e-footprint quickstart
This notebook provides an example scenario that you can use to get familiar with the Python API of efootprint: the daily video consumption of all French households on a big streaming platform.
You will get to describe: - the infrastructure involved (serveurs with auto-scaling settings, storage, service and network) - the user journey involving 2 steps (Streaming, Upload) - the usage pattern and the device population that executes it (the laptops of all French households)
Import the packages
⚠ If this steps fails, remember to run ipython kernel install --user --name=efootprint-kernel inside your python virtual environement (initializable with poetry install) to be able to select efootprint-kernel as the jupyter kernel.
from efootprint.abstract_modeling_classes.source_objects import SourceValue, Sources, SourceObject
from efootprint.core.usage.user_journey import UserJourney
from efootprint.core.usage.user_journey_step import UserJourneyStep
from efootprint.core.usage.job import Job
from efootprint.core.hardware.servers.autoscaling import Autoscaling
from efootprint.core.hardware.storage import Storage
from efootprint.core.service import Service
from efootprint.core.hardware.device_population import DevicePopulation
from efootprint.core.usage.usage_pattern import UsagePattern
from efootprint.core.hardware.network import Network
from efootprint.core.system import System
from efootprint.constants.countries import Countries
from efootprint.constants.units import u
from efootprint.utils.object_relationships_graphs import USAGE_PATTERN_VIEW_CLASSES_TO_IGNORE
from efootprint.builders.hardware.devices_defaults import default_laptop

import os
Define the infrastructure
An e-footprint object has a name and attributes describing its technical and environmental characteristics:
server = Autoscaling(
    "server",
    carbon_footprint_fabrication=SourceValue(600 * u.kg, Sources.BASE_ADEME_V19),
    power=SourceValue(300 * u.W, Sources.HYPOTHESIS),
    lifespan=SourceValue(6 * u.year, Sources.HYPOTHESIS),
    idle_power=SourceValue(50 * u.W, Sources.HYPOTHESIS),
    ram=SourceValue(128 * u.GB, Sources.HYPOTHESIS),
    cpu_cores=SourceValue(24 * u.core, Sources.HYPOTHESIS),
    power_usage_effectiveness=SourceValue(1.2 * u.dimensionless, Sources.HYPOTHESIS),
    average_carbon_intensity=SourceValue(100 * u.g / u.kWh, Sources.HYPOTHESIS),
    server_utilization_rate=SourceValue(0.9 * u.dimensionless, Sources.HYPOTHESIS))
Moreover, all e-footprint objects have a calculated_attributes attributes that shows the list of attributes that are setup as None and then computed by e-footprint when the modeling is over. For example, for our server:
Autoscaling server 25df83

carbon_footprint_fabrication: 600 kilogram
power: 300 watt
lifespan: 6 year
fraction_of_usage_time: 1 dimensionless
average_carbon_intensity: 100.0 gram / kilowatt_hour
server_utilization_rate: 0.9 dimensionless
idle_power: 50 watt
ram: 128 gigabyte
cpu_cores: 24 core
power_usage_effectiveness: 1.2 dimensionless

calculated_attributes:
  available_ram_per_instance: None
  available_cpu_per_instance: None
  all_services_cpu_needs: None
  all_services_ram_needs: None
  fraction_of_time_in_use: None
  nb_of_instances: None
  instances_fabrication_footprint: None
  instances_power: None
  energy_footprint: None
More information on e-footprint objects’ calculated_attributes can be found in the e-footprint documentation.
storage = Storage(
    "SSD storage",
    carbon_footprint_fabrication=SourceValue(160 * u.kg, Sources.STORAGE_EMBODIED_CARBON_STUDY),
    power=SourceValue(1.3 * u.W, Sources.STORAGE_EMBODIED_CARBON_STUDY),
    lifespan=SourceValue(6 * u.years, Sources.HYPOTHESIS),
    idle_power=SourceValue(0 * u.W, Sources.HYPOTHESIS),
    storage_capacity=SourceValue(1 * u.TB, Sources.STORAGE_EMBODIED_CARBON_STUDY),
    power_usage_effectiveness=SourceValue(1.2 * u.dimensionless, Sources.HYPOTHESIS),
    average_carbon_intensity=SourceValue(100 * u.g / u.kWh),
    data_replication_factor=SourceValue(3 * u.dimensionless, Sources.HYPOTHESIS))
Apart from environmental and technical attributes, e-footprint objects can link to other e-footprint objects. For example, the following service runs on the server and uploads data to the storage:
service = Service(
    "Streaming platform",
    server=server,
    storage=storage,
    base_ram_consumption=SourceValue(300 * u.MB, Sources.HYPOTHESIS),
    base_cpu_consumption=SourceValue(2 * u.core, Sources.HYPOTHESIS))
Define the user journey
This is the modeling of the average daily usage of the streaming platform in France:
streaming_step = UserJourneyStep(
    "20 min streaming",
    user_time_spent=SourceValue(20 * u.min / u.uj, Sources.USER_DATA),
    jobs=[
        Job(
            "streaming",
            service=service,
            data_upload=SourceValue(0.05 * u.MB / u.uj, Sources.USER_DATA),
            data_download=SourceValue(800 * u.MB / u.uj, Sources.USER_DATA),
            request_duration=SourceValue(4 * u.min, Sources.HYPOTHESIS),
            cpu_needed=SourceValue(1 * u.core / u.uj, Sources.HYPOTHESIS),
            ram_needed=SourceValue(50 * u.MB / u.uj, Sources.HYPOTHESIS)
            )
        ]
    )
upload_step = UserJourneyStep(
    "1 min video capture then upload",
    user_time_spent=SourceValue(70 * u.s / u.uj, Sources.USER_DATA),
    jobs=[
        Job(
            "video upload",
            service=service,
            data_upload=SourceValue(20 * u.MB / u.uj, Sources.USER_DATA),
            data_download=SourceValue(0 * u.GB / u.uj, Sources.USER_DATA),
            request_duration=SourceValue(2 * u.s, Sources.HYPOTHESIS),
            cpu_needed=SourceValue(1 * u.core / u.uj, Sources.HYPOTHESIS),
            ram_needed=SourceValue(50 * u.MB / u.uj, Sources.HYPOTHESIS)
        )
    ]
)
The user journey is then simply a list of user journey steps:
user_journey = UserJourney("Mean video consumption user journey", uj_steps=[streaming_step, upload_step])
Define the device population and how often it runs the user journey
device_population = DevicePopulation(
    "French households’ laptops",
    nb_devices=SourceValue(4e7 * 0.3 * u.user, Sources.USER_DATA),
    country=Countries.FRANCE(),
    devices=[default_laptop()])

network = Network(
        "WIFI network",
        bandwidth_energy_intensity=SourceValue(0.05 * u("kWh/GB"), Sources.TRAFICOM_STUDY))

usage_pattern = UsagePattern(
    "Daily video streaming consumption",
    user_journey=user_journey,
    device_population=device_population,
    network=network,
    user_journey_freq_per_user=SourceValue(365 * u.user_journey / (u.user * u.year), Sources.USER_DATA),
    time_intervals=SourceObject([[7, 12], [17, 23]]))

system = System("System", usage_patterns=[usage_pattern])
2024-04-06 19:09:13,298 - INFO - Computing calculated attributes for System System
2024-04-06 19:09:13,299 - INFO - Computing calculated attributes for UserJourney Mean video consumption user journey
2024-04-06 19:09:13,301 - INFO - Computing calculated attributes for UsagePattern Daily video streaming consumption
2024-04-06 19:09:13,302 - INFO - Computing calculated attributes for DevicePopulation French households’ laptops
2024-04-06 19:09:13,305 - INFO - Computing calculated attributes for Service Streaming platform
2024-04-06 19:09:13,311 - INFO - Computing calculated attributes for Network WIFI network
2024-04-06 19:09:13,314 - INFO - Computing calculated attributes for Autoscaling server
2024-04-06 19:09:13,322 - INFO - Computing calculated attributes for Storage SSD storage
Results
Computed attributes
Now all calculated_attributes have been computed:
Autoscaling server 25df83

carbon_footprint_fabrication: 600 kilogram
power: 300 watt
lifespan: 6 year
fraction_of_usage_time: 1 dimensionless
average_carbon_intensity: 100.0 gram / kilowatt_hour
server_utilization_rate: 0.9 dimensionless
idle_power: 50 watt
ram: 128 gigabyte
cpu_cores: 24 core
power_usage_effectiveness: 1.2 dimensionless

calculated_attributes:
  available_ram_per_instance: 114.9 gigabyte
  available_cpu_per_instance: 19.6 core
  all_services_cpu_needs: [0.0 core, 0.0 core, 0.0 core, 0.0 core, 0.0 core, 73283.32 core, 73283.32 core, 73283.32 core, 73283.32 core, 73283.32 core, 0.0 core, 0.0 core, 0.0 core, 0.0 core, 0.0 core, 73283.32 core, 73283.32 core, 73283.32 core, 73283.32 core, 73283.32 core, 73283.32 core, 0.0 core, 0.0 core, 0.0 core]
  all_services_ram_needs: [0.0 gigabyte, 0.0 gigabyte, 0.0 gigabyte, 0.0 gigabyte, 0.0 gigabyte, 3664.17 gigabyte, 3664.17 gigabyte, 3664.17 gigabyte, 3664.17 gigabyte, 3664.17 gigabyte, 0.0 gigabyte, 0.0 gigabyte, 0.0 gigabyte, 0.0 gigabyte, 0.0 gigabyte, 3664.17 gigabyte, 3664.17 gigabyte, 3664.17 gigabyte, 3664.17 gigabyte, 3664.17 gigabyte, 3664.17 gigabyte, 0.0 gigabyte, 0.0 gigabyte, 0.0 gigabyte]
  fraction_of_time_in_use: 0.46 dimensionless
  nb_of_instances: 1713.71 dimensionless
  instances_fabrication_footprint: 171370.83 kilogram / year
  instances_power: 5408052.21 kilowatt_hour / year
  energy_footprint: 540805.22 kilogram / year
System footprint overview
Object relationships graph
Hover over a node to get the numerical values of its environmental and technical attributes. For simplifying the graph the Network and Hardware nodes are not shown.
usage_pattern.object_relationship_graph_to_file("object_relationships_graph.html",
    classes_to_ignore=USAGE_PATTERN_VIEW_CLASSES_TO_IGNORE, width="800px", height="600px", notebook=True)
Calculus graph
Any e-footprint calculation can generate its calculation graph for full auditability. Hover on a calculus node to display its formula and numeric value.
device_population.instances_fabrication_footprint.calculus_graph_to_file(
    "device_population_fab_footprint_calculus_graph.html", width="800px", height="500px", notebook=True)
Analysing the impact of a change
Numeric input change
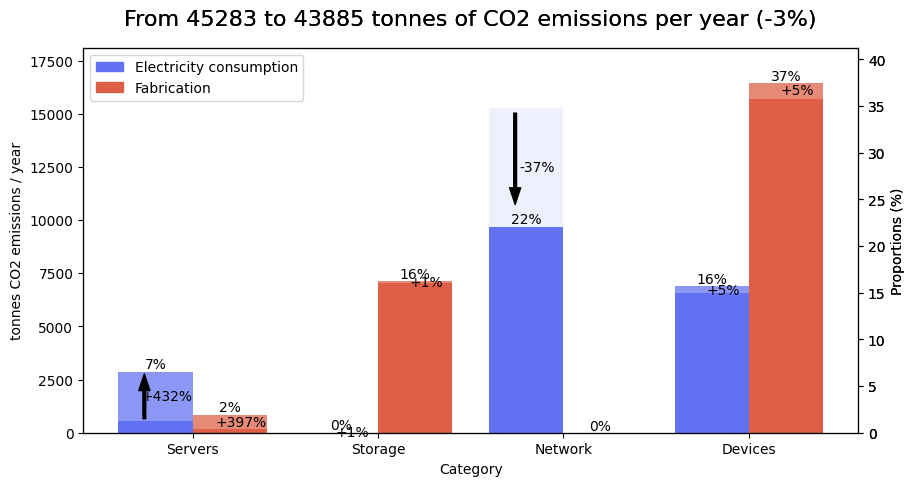
Any input change automatically triggers the computation of calculations that depend on the input. For example, let’s say that the average data download consumption of the streaming step decreased because of a change in default video quality:
Plotting the impact of streaming’s data_download changing from 800.0 megabyte / user_journey to 500.0 megabyte / user_journey
System structure change
Now let’s make a more complex change, like adding a conversation with a generative AI chatbot before streaming the video. Numerical values don’t matter so much for the sake of this tutorial, please check out the e-footprint-modelings github repository for a more detailed modeling of the impact of LLM training and inference.
llm_server = Autoscaling(
    "Inference GPU server",
    carbon_footprint_fabrication=SourceValue(4900 * u.kg, Sources.HYPOTHESIS),
    power=SourceValue(6400 * u.W, Sources.HYPOTHESIS),
    lifespan=SourceValue(5 * u.year, Sources.HYPOTHESIS),
    idle_power=SourceValue(500 * u.W, Sources.HYPOTHESIS),
    ram=SourceValue(128 * u.GB, Sources.HYPOTHESIS),
    cpu_cores=SourceValue(16 * u.core, Sources.HYPOTHESIS), # Used to represent GPUs because e-footprint doesn’t natively model GPU resources yet.
    power_usage_effectiveness=SourceValue(1.2 * u.dimensionless, Sources.HYPOTHESIS),
    average_carbon_intensity=SourceValue(300 * u.g / u.kWh, Sources.HYPOTHESIS),
    server_utilization_rate=SourceValue(1 * u.dimensionless, Sources.HYPOTHESIS))
service_inference = Service(
    "LLM inference", llm_server, storage, base_ram_consumption=SourceValue(0 * u.MB, Sources.HYPOTHESIS),
    base_cpu_consumption=SourceValue(0 * u.core, Sources.HYPOTHESIS))

llm_chat_step = UserJourneyStep(
    "Chat with LLM to select video", user_time_spent=SourceValue(1 * u.min / u.uj, Sources.HYPOTHESIS),
    jobs=[Job("LLM API", service_inference, SourceValue(300 * u.kB / u.uj, Sources.USER_DATA),
              SourceValue(300 * u.kB / u.uj, Sources.USER_DATA), request_duration=SourceValue(5 * u.s, Sources.HYPOTHESIS),
              cpu_needed=SourceValue(16 * u.core / u.uj, Sources.HYPOTHESIS),
              ram_needed=SourceValue(128 * u.GB / u.uj, Sources.HYPOTHESIS))])
# Adding the new step is simply an attribute update.
# Don’t use user_journey.uj_steps.append(llm_chat_step) as e-footprint recomputation logic wouldn’t be triggered
user_journey.uj_steps += [llm_chat_step]
2024-04-06 19:09:15,935 - INFO - Computing calculated attributes for UserJourney Mean video consumption user journey
2024-04-06 19:09:15,937 - INFO - Computing calculated attributes for UsagePattern Daily video streaming consumption
2024-04-06 19:09:15,939 - INFO - Computing calculated attributes for DevicePopulation French households’ laptops
2024-04-06 19:09:15,942 - INFO - Computing calculated attributes for Service Streaming platform
2024-04-06 19:09:15,948 - INFO - Computing calculated attributes for Service LLM inference
2024-04-06 19:09:15,952 - INFO - Computing calculated attributes for Network WIFI network
2024-04-06 19:09:15,955 - INFO - Computing calculated attributes for Autoscaling server
2024-04-06 19:09:15,963 - INFO - Computing calculated attributes for Storage SSD storage
2024-04-06 19:09:15,971 - INFO - Computing calculated attributes for Autoscaling Inference GPU server
Plotting the impact of Mean video consumption user journey’s uj_steps changing from ['20 min streaming', '1 min video capture then upload'] to ['20 min streaming', '1 min video capture then upload', 'Chat with LLM to select video']
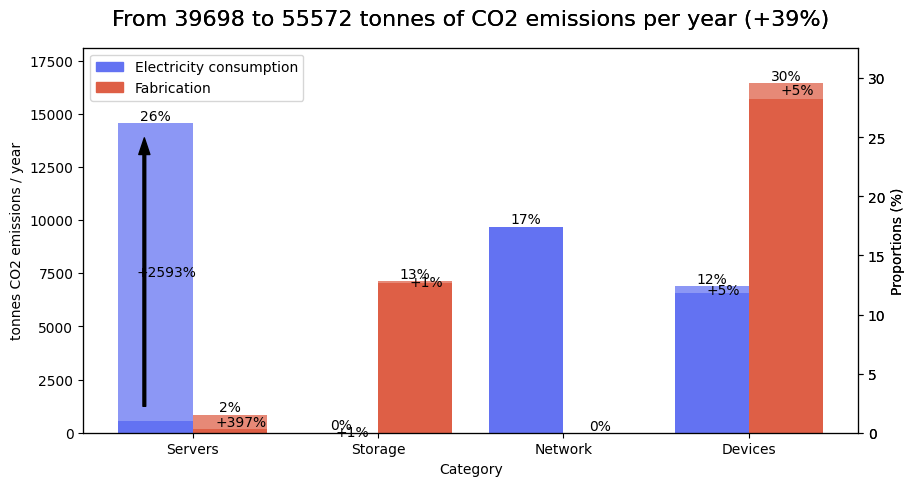
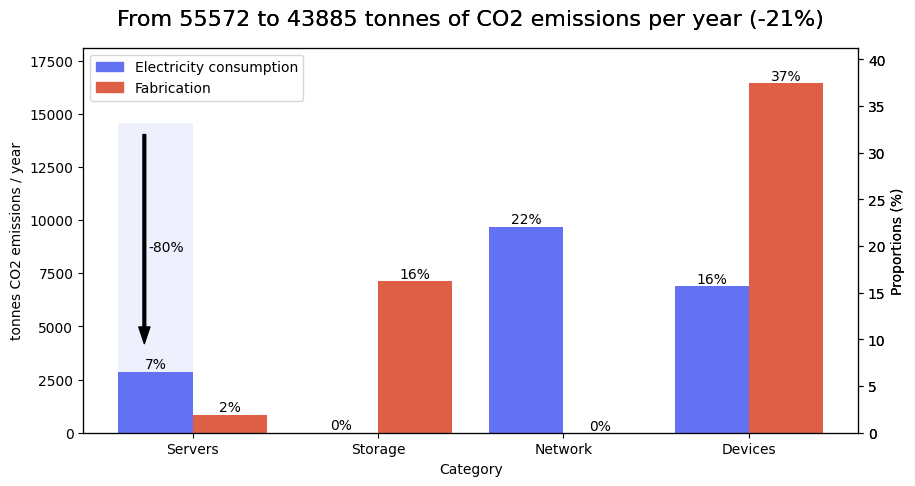
We can see that server energy footprint has been multiplied by more than 10 and the rest of the impact is quite negligible. Good to know to make informed decisions ! Of course the impact is very much dependent on assumptions. If the LLM server ran on low-carbon electricity for example:
llm_server.average_carbon_intensity=SourceValue(50 * u.g / u.kWh, Sources.HYPOTHESIS)
system.plot_emission_diffs("lower LLM inference carbon intensity.png")
Plotting the impact of Inference GPU server’s average_carbon_intensity changing from 300.0 gram / kilowatt_hour to 50.0 gram / kilowatt_hour
Recap of all System changes
Plotting the impact of:

- streaming’s data_download changing from 800.0 megabyte / user_journey to 500.0 megabyte / user_journey
- Mean video consumption user journey’s uj_steps changing from ['20 min streaming', '1 min video capture then upload'] to ['20 min streaming', '1 min video capture then upload', 'Chat with LLM to select video']
- Inference GPU server’s average_carbon_intensity changing from 300.0 gram / kilowatt_hour to 50.0 gram / kilowatt_hour